ai-agent-profiler sits between your coding agent and the LLM provider. The agent thinks it’s talking to the API directly. In reality, every request passes through a local proxy that captures, analyzes, and optionally modifies it before forwarding.
The pipeline
Layer 1: Capture
The proxy listens on a local port (default localhost:8787). The agent is configured to route API calls through this port instead of directly to the provider.
# Agent configuration
export OPENAI_BASE_URL="http://localhost:8787/v1"
export ANTHROPIC_BASE_URL="http://localhost:8787/v1"

# Or via config.toml
[providers]
deepseek = { api_key = "...", base_url = "https://api.deepseek.com" }
anthropic = { api_key = "...", base_url = "https://api.anthropic.com" }
Every arriving request is captured as raw bytes and assigned a unique trace ID. The raw request and response are written to disk as .ndjson files in traces/<session-id>/. Nothing is lost.
The capture layer is provider-agnostic. It doesn’t parse the request body yet. It just stores the raw HTTP exchange: headers, body, status code, timing.
Layer 2: Parse
aap parse reads the raw .ndjson traces and extracts structured data:
- Request metadata. Method, URL, timing, status code
- Request body. Parsed as JSON. Extracts model name, messages array, system prompt, tool definitions
- Response body. Extracts completion tokens, prompt tokens, cached tokens, finish reason
- Classification. Runs
classifyRequestKind()on each request to tag it asmain,search,title, etc.
The parsed data is written to aap.sqlite with foreign keys linking requests to sessions, tool calls to requests, and optimize actions to tool calls.
Parsing is idempotent and replayable. Run aap parse --all to re-parse every session. Run aap parse --session <id> to re-parse a specific one. The classifier rules can change, and the database updates accordingly.
Layer 3: Classify
The classifier tags every request with a kind. It uses two independent signal sources:
System prompt markers. Claude Code subagents self-identify with cc_is_subagent=true in a billing header. OpenCode agents self-identify in per-agent system prompts. The classifier checks for known patterns: “file search specialist” → search, “Claude guide agent” → guide, “title generator” → title.
Last message text. Some requests are distinguishable only by their final instruction. Recaps check for “The user stepped away.” Compactions look for summary text. Title generation checks for “Generate a title.”
The classifier is careful to match only the last user message (not the full transcript) and only text blocks (not tool results). Matching anywhere in history produces false positives: an earlier summary echoed into later context gets misclassified as compact.
Layer 4: Optimize (optional)
The optimize layer intercepts requests before they reach the provider and applies reduction rules:
| Rule | Trigger | Action | Tokens saved (avg) |
|---|---|---|---|
| prune_stale | Tool results older than last user message | Remove from context | ~2.8M per session |
| truncate | Tool output > 1,500 tokens | Keep first 1,500 tokens | ~200K per session |
| dedup | Same file read twice consecutively | Keep one copy | ~28K per hit |
| frozen_compact | Context > threshold | Replace full history with summary | ~49K per compact |
| stable_truncate | Large conversation array | Truncate middle, keep beginning and end | ~38K per truncation |
Each rule runs as a middleware in the proxy pipeline. If the request matches a rule’s trigger, the rule modifies the request body before forwarding. The original and modified versions are both logged.
Optimize is opt-in via config.toml. Disabled by default. The dashboard shows what rules fired and how many tokens they saved.
Storage
Three storage components:
aap.sqlite. SQLite database. Stores sessions, requests (parsed and classified), tool calls, optimize actions. Schema uses foreign keys with cascade deletes. Indexes on session_id, timestamp, kind, and model. Full-text search via FTS5.
search.sqlite. Separate SQLite database for FTS5 content search across all tool call and command output text. Built from chunks of tool result text.
traces/*.ndjson. Raw NDJSON files, one line per request, written by the capture layer. Source of truth. If the database is corrupted, re-parse from traces.
Dashboard
The dashboard is a single-page HTML application served from aap serve. It queries aap.sqlite directly and renders:
- Session list with cost, duration, request count, project
- Per-session view with request timeline, tool call tree, kind breakdown
- Cost by kind table with percentages
- Tool frequency chart
- Optimize action list with tokens saved
No backend beyond SQLite queries. The dashboard is a read-only view onto the database.
Dashboard overview
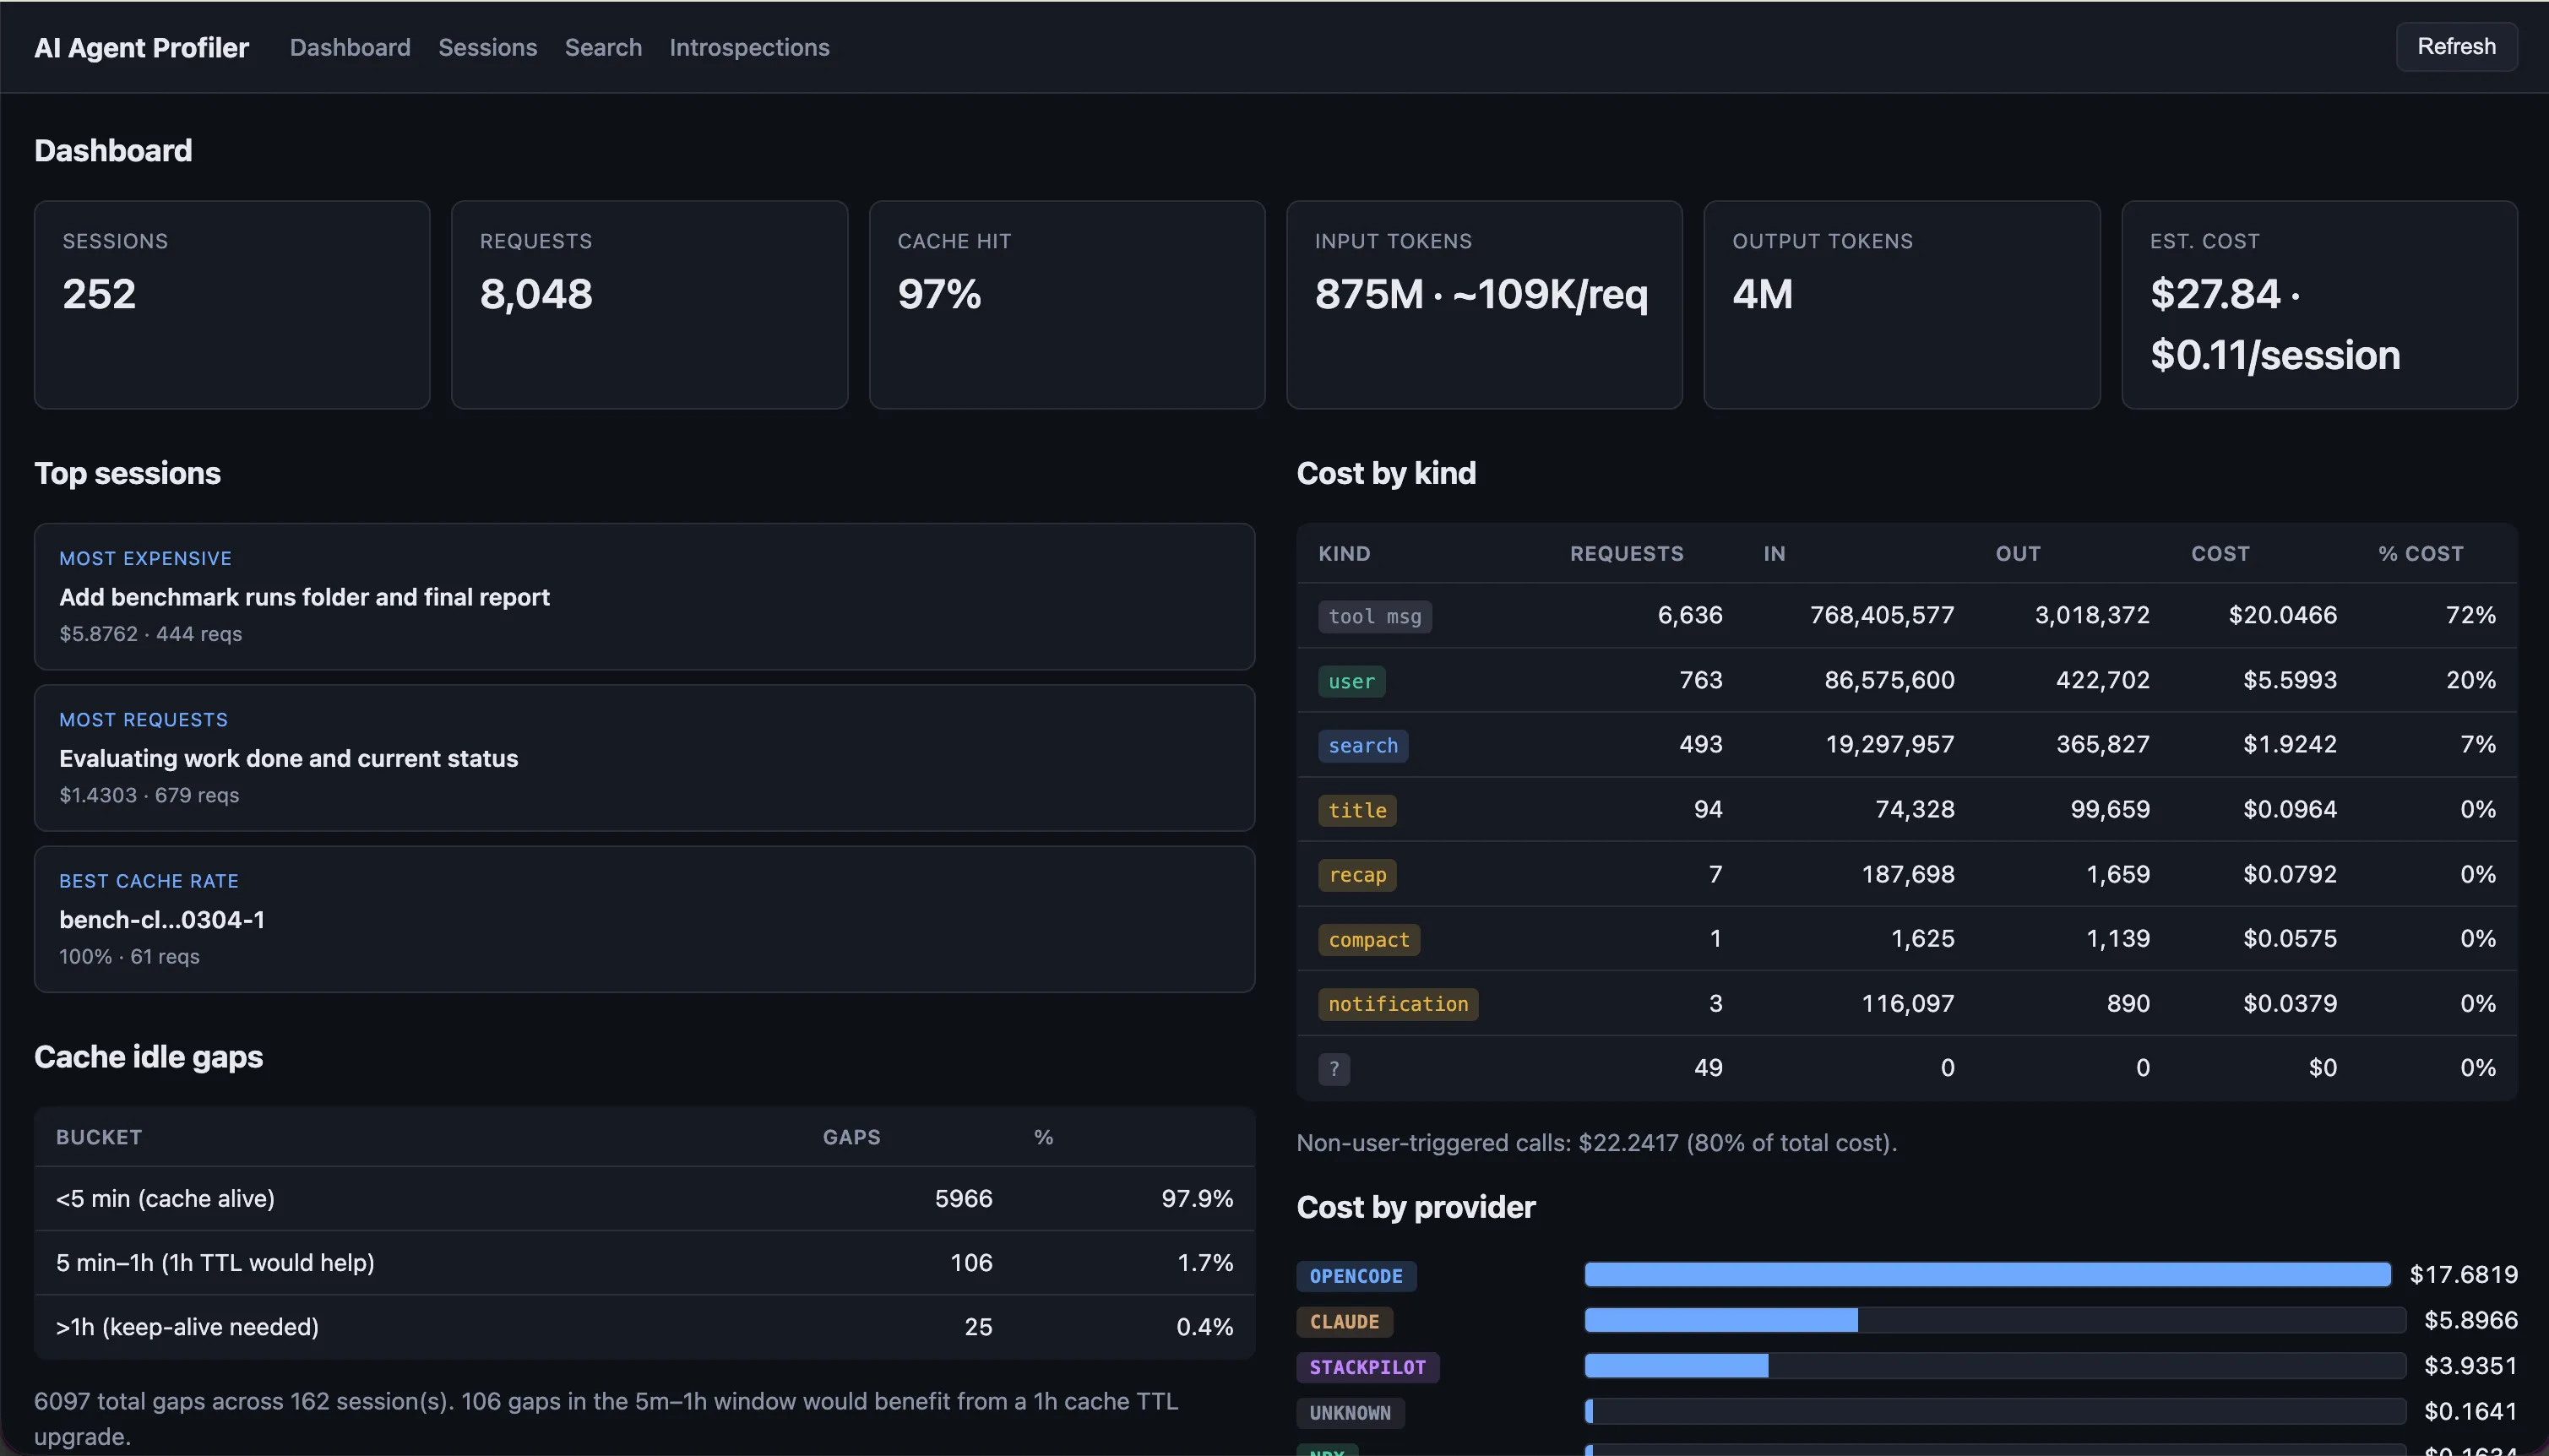
The main dashboard displays:
- Session summary: Quick overview of all sessions with metrics like total cost, duration, and request count
- Session list: Chronological list of all recorded sessions
- Tokens overview: Breakdown of token usage across all sessions and request types
- Tool usage distribution: Which tools (file reads, bash commands, edits) were most frequently called
- Cost by provider: Comparison of spending across different LLM providers (DeepSeek, Claude, etc.)
Session details: top page
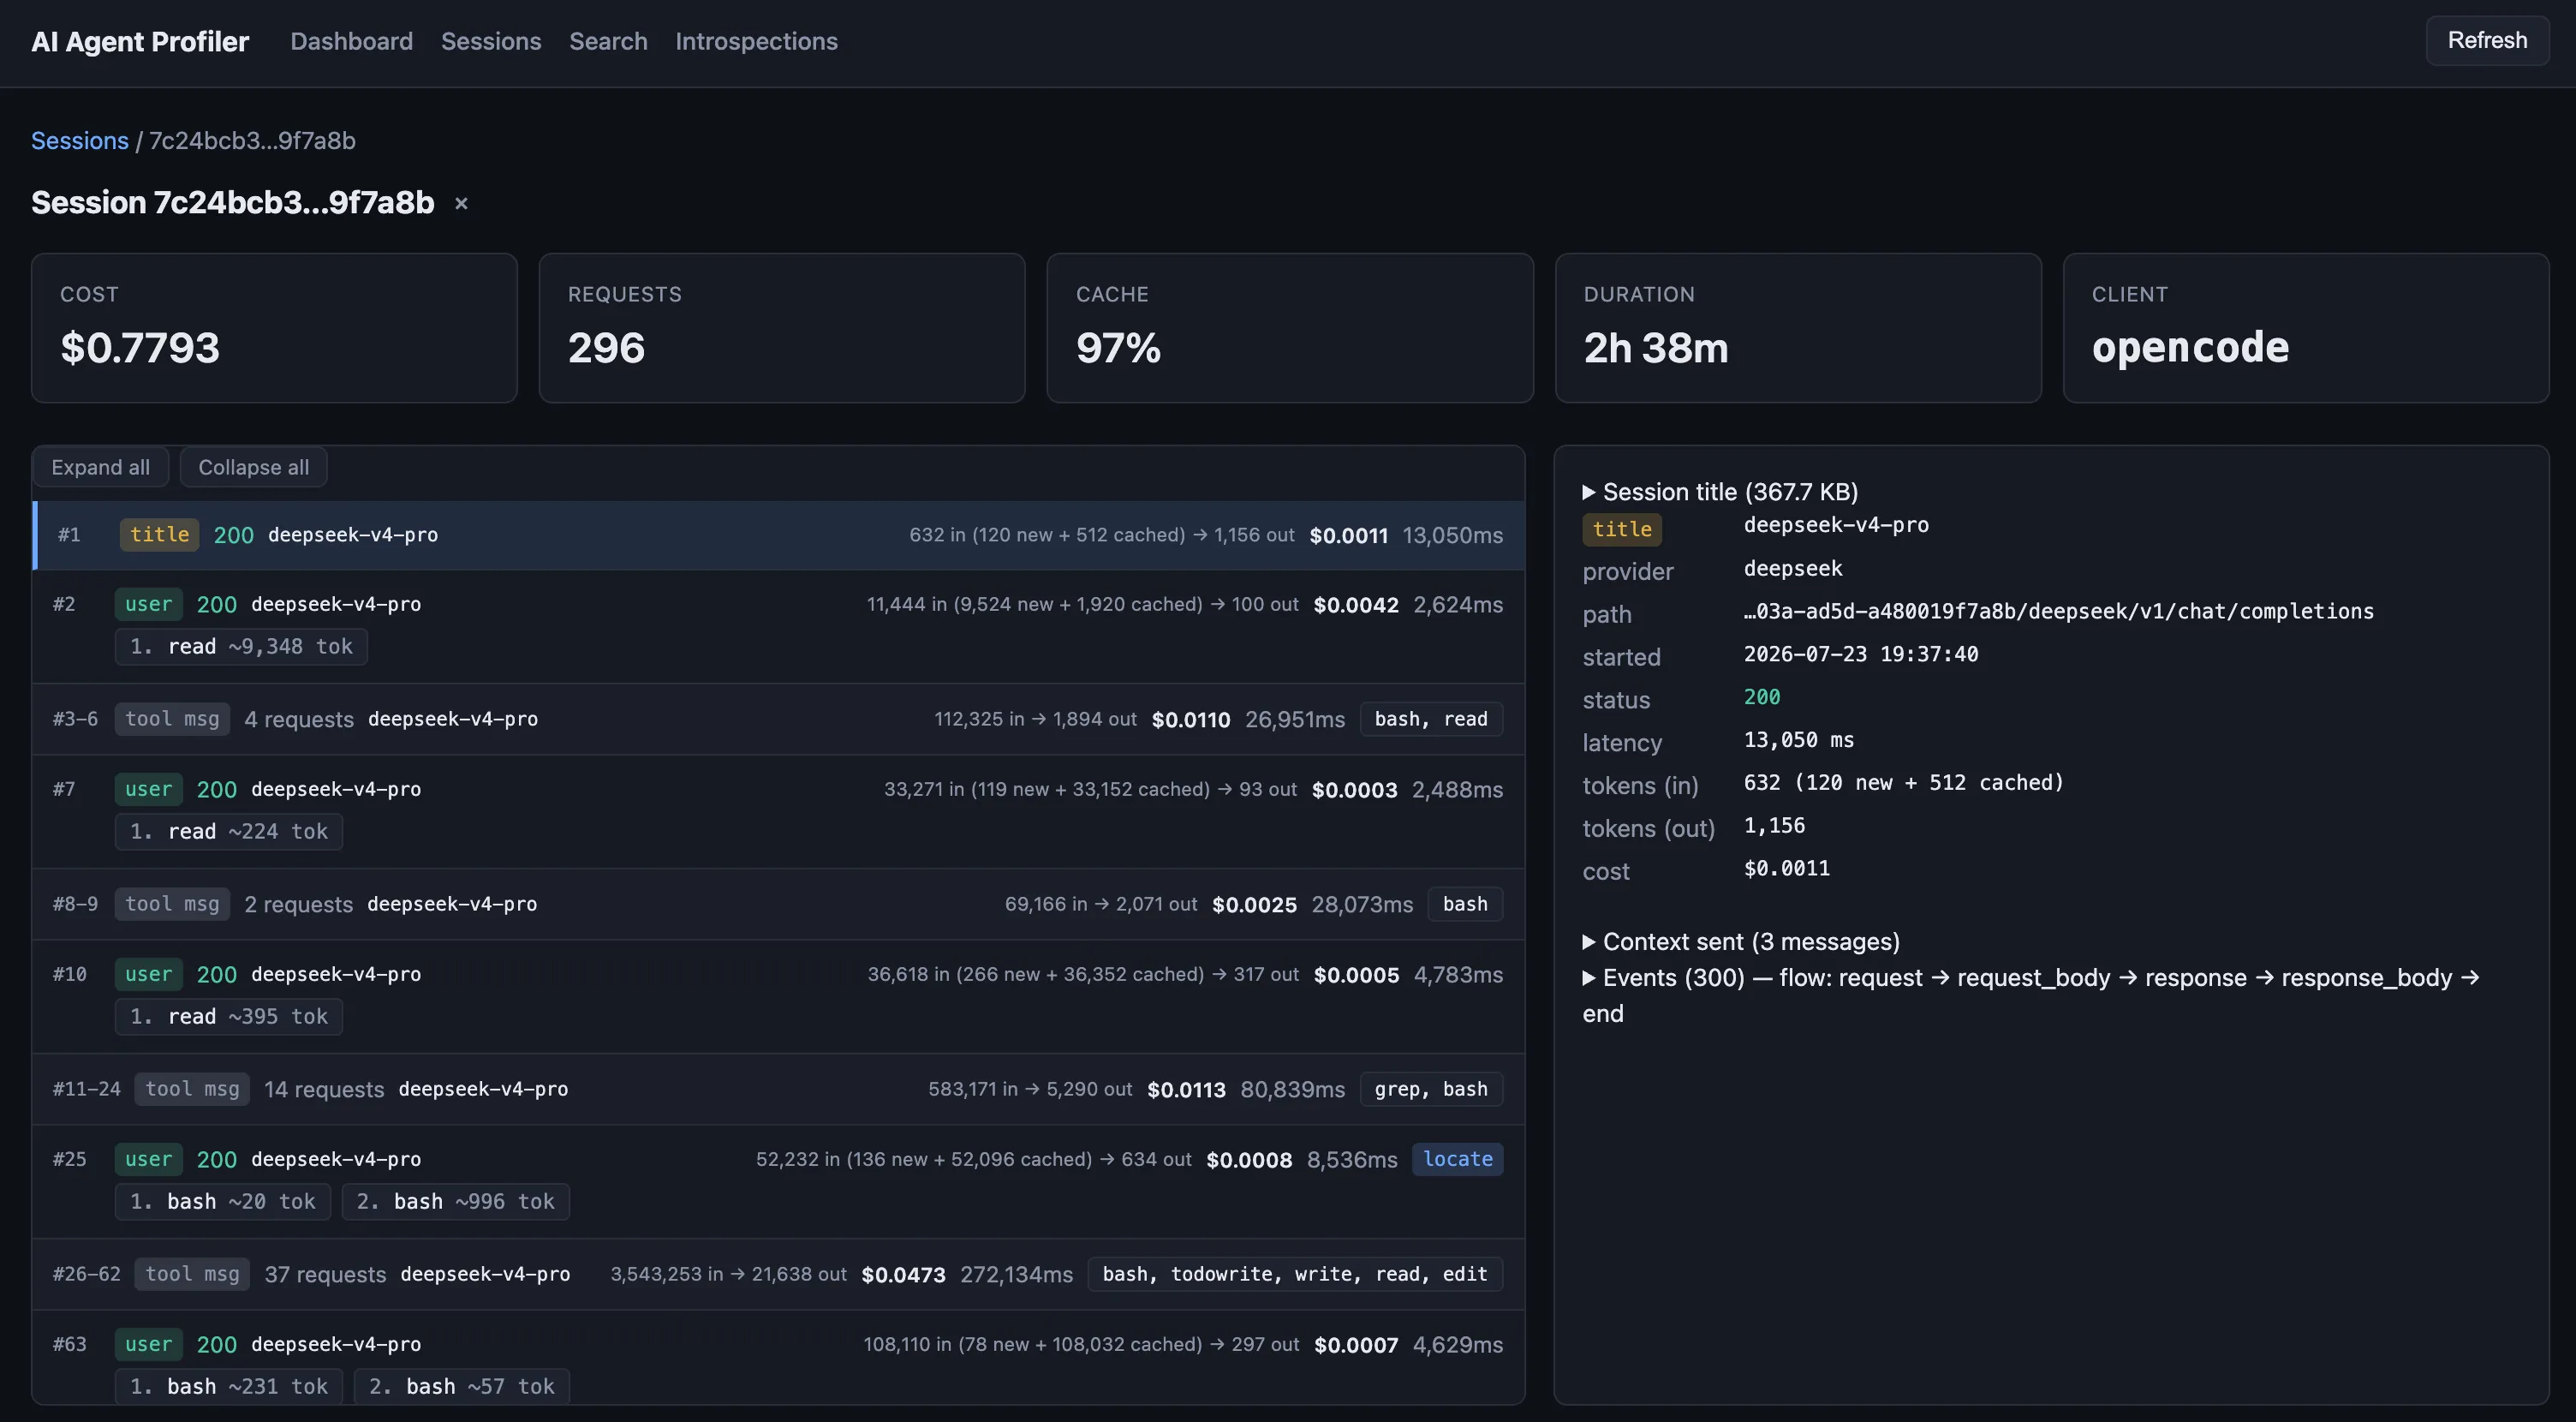
Each session page starts with:
- Session summary: Cost, duration, total requests, and token breakdown for this specific session
- Request count: Total number of API calls made in this session
- Token metrics: Prompt tokens, completion tokens, cached tokens
- Cache utilization: How much caching helped reduce costs
- Request timeline: Chronological list of all requests with their type (main, search, title, etc.), model, tokens, and cost
Session details: bottom page
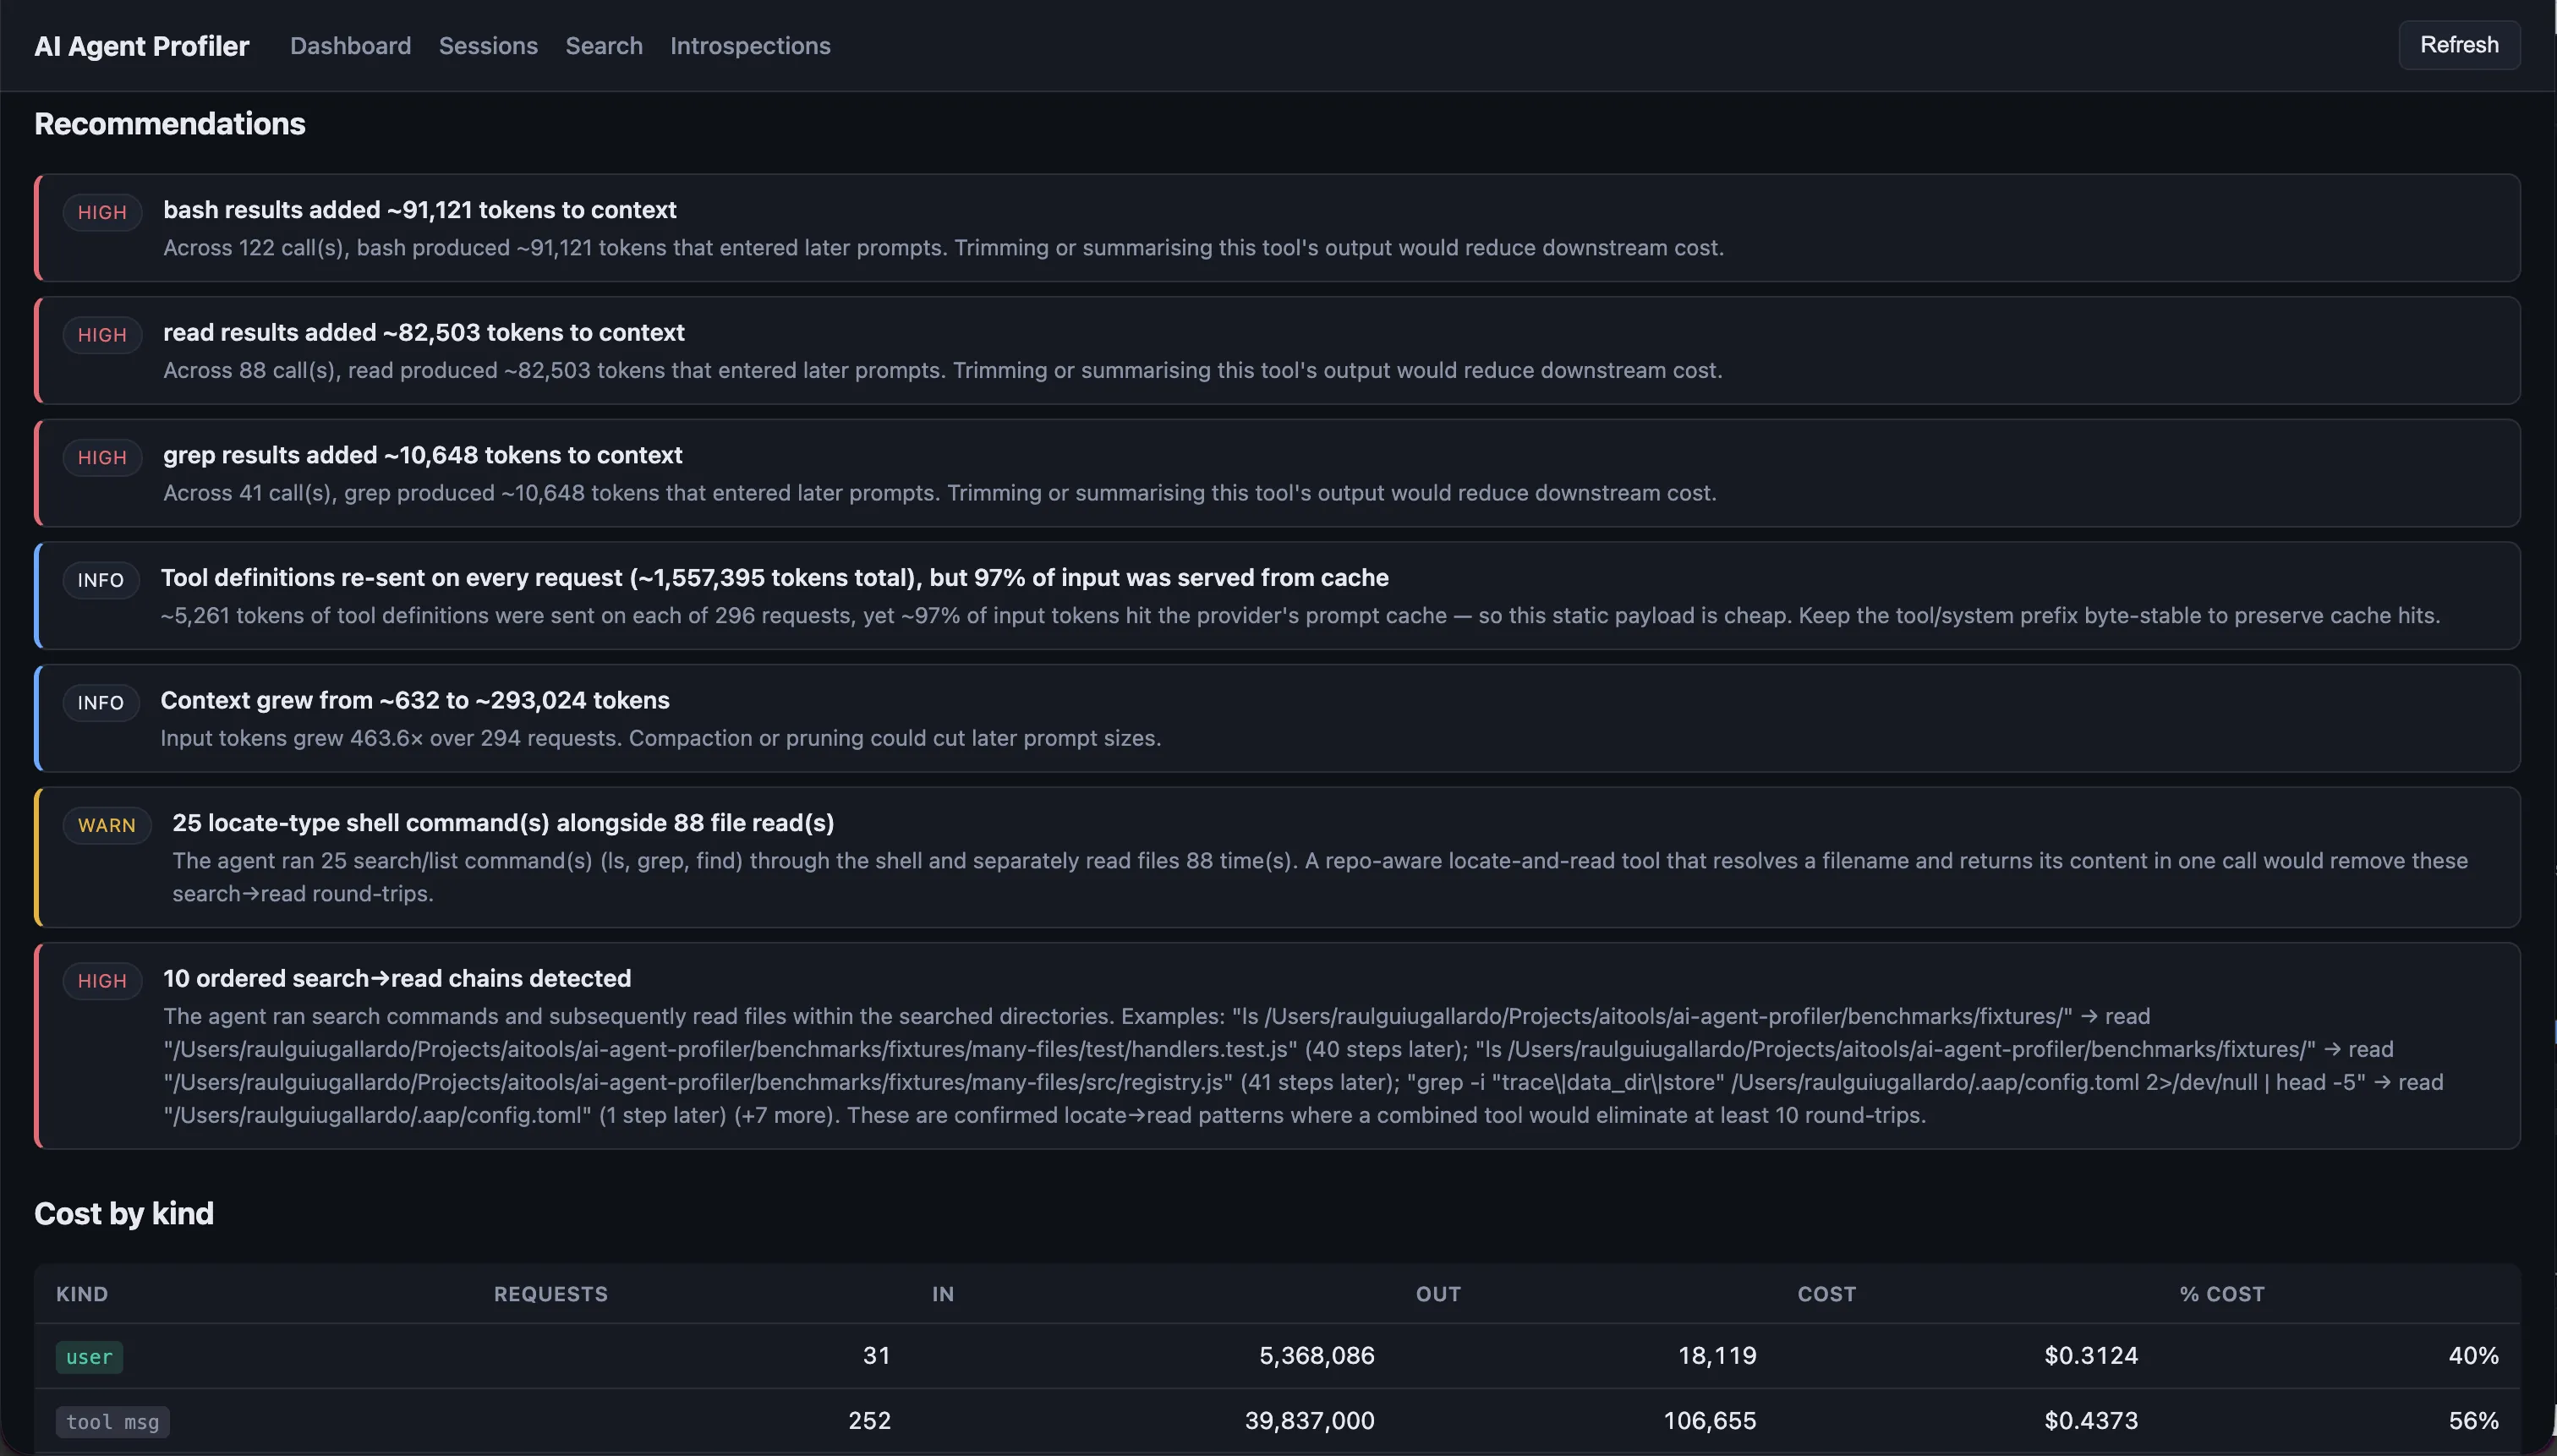
Below the request timeline:
- Usage recommendations: Intelligent suggestions for optimizing this session (e.g., “Enable truncation to save ~200K tokens”, “Consider cache-aware request batching”)
- Cost breakdown by request type: Table showing which request kinds (main, search, guidance, etc.) consumed the most cost and tokens
- Cost efficiency metrics: Cost per request, cost per thousand tokens, and comparisons to baseline
MCP server
aap exposes an MCP (Model Context Protocol) server that allows AI coding agents to query their own profile data:
get_session_summary(session_id): cost, duration, requests, toolsget_cost_by_kind(session_id): cost breakdown by request kindget_top_tools(session_id): most frequent tool callsget_optimize_actions(session_id): tokens saved by optimization ruleslist_sessions(project): recent sessions for a project
This lets the agent introspect on its own performance. A conversation might go: “You spent $0.14 on 49 requests last session. 70% was tool results. Want me to enable truncation?”
Why SQLite
Single file. Zero configuration. No server process. Backs up with cp. Queries with any SQLite client. The dashboard reads it directly via better-sqlite3 in-process. No network between the dashboard and the data.
At 6,767 requests across 160 sessions, the database is 1.2MB. SQLite handles millions of rows without issue. The traces are heavier (5.3GB) but that is raw NDJSON; you re-parse them, you do not query them.
Running it
# Start the proxy
aap proxy

# Parse all sessions
aap parse --all

# Start the dashboard
aap serve

# Run introspection
aap introspect

# Build static GH Pages deploy
aap dashboard:build
The proxy, parser, dashboard, and MCP server all run from the same binary (aap). No external dependencies beyond Node.js and SQLite.