When you run a coding agent, you think it makes a few API calls. In reality, it’s much noisier. The agent calls the LLM for every tool invocation, every search, every background task. After profiling 9,631 LLM requests across 279 sessions over 17 days, the data tells a clear story: 80.5% of all traffic is the agent talking to itself, not responding to you.
AI Agent Profiler is a local-first HTTP proxy that sits between coding agents (Claude Code, opencode, StackPilot) and LLM providers (Anthropic, DeepSeek, OpenAI, Ollama). It captures every byte at wire speed, parses four different streaming formats into a unified SQLite schema, and surfaces the hidden machinery of agent execution.
The Key Stats
- 9,631 LLM requests over 17 days
- 13,282 tool calls across 279 sessions
- 80.5% agent-to-agent traffic (not user-driven)
- ~13 tool calls per user message
- 96.7% cache hit rate
- $33.88 total cost for 1.0 GB of traces
Architecture: Three Independent Pipelines
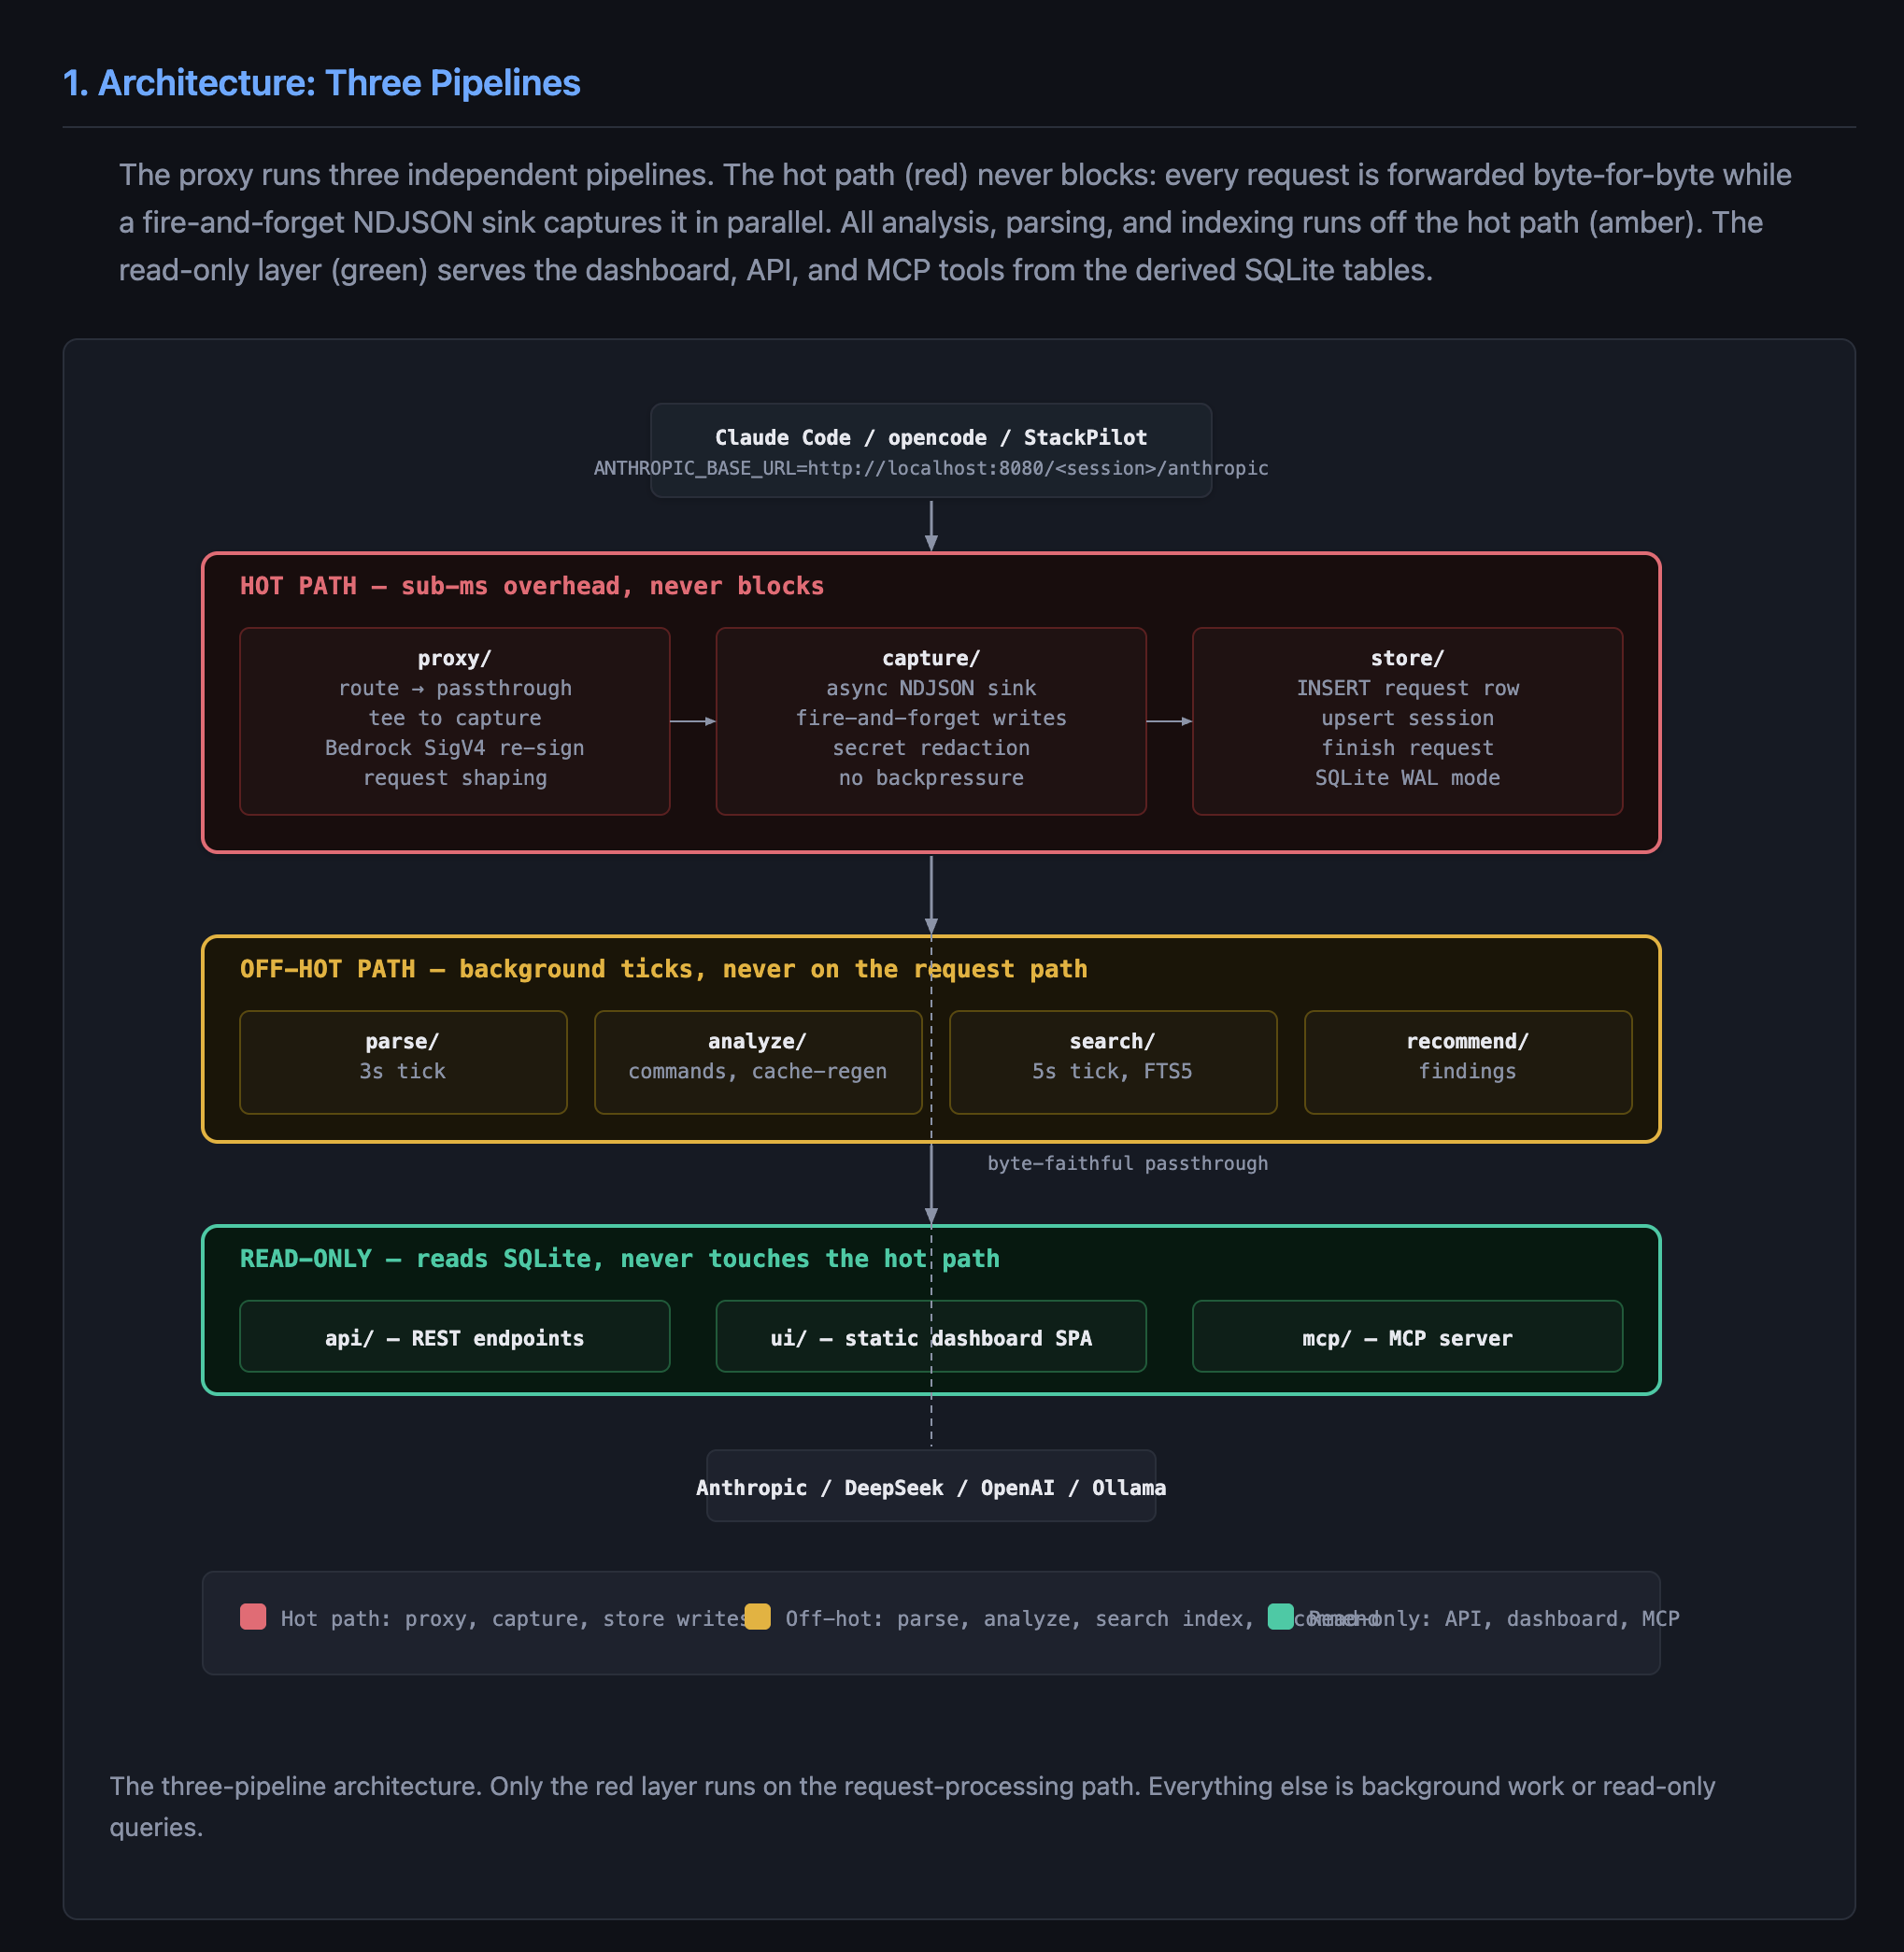
AAP runs three independent pipelines. The fundamental rule: the hot path is untouchable.
- Hot path (red): The proxy routes every request byte-for-byte while a fire-and-forget NDJSON sink captures it in parallel. Zero backpressure. Sub-millisecond overhead.
- Off-hot path (amber): All analysis, parsing, and indexing runs in background ticks (3s for parsing, 5s for search indexing). Never on the request path.
- Read-only layer (green): Dashboard, REST API, CLI commands, and MCP tools serve from derived SQLite tables.
Session Lifecycle
aap run claudegenerates a session UUID, detects the git repo, POSTs session metadata to the proxy’s control endpoint.- Environment variables are overridden so the agent sends all traffic through the proxy (
ANTHROPIC_BASE_URL=http://localhost:8080/<session>/anthropic). - The proxy strips the
/<session_id>/<provider>prefix and forwards byte-for-byte upstream. - Request/response bytes are teed into an async NDJSON sink that never applies backpressure. Each request gets a UUID-named
.ndjsonfile. - A 3s background tick reads finished traces, extracts metrics, and writes them to SQLite.
- A 5s tick indexes parsed content into an FTS5 search index.
- Raw traces remain authoritative. The entire metrics layer can be rebuilt with
aap parse --all.
Proxy Architecture: No MITM, Just Environment
AAP operates as an application-level base-URL reverse proxy, not a TLS-intercepting MITM. This eliminates the need for Root CA certificates, system trust store configuration, and TLS termination complexity. Instead, agents are redirected by altering their provider endpoint settings.
Multiplexed Routing
Different AI SDKs treat base URLs differently. AAP handles three routing patterns over a single HTTP port using order-of-precedence matching:
Incoming Request → [1. Bedrock Shim?] → [2. Ollama Shim?] → [3. Standard Prefix Route] → Forward
Session Injection
-
opencode: Single JSON blob overrides all providers at once:
OPENCODE_CONFIG_CONTENT={"provider":{"deepseek":{"options":{"baseURL":"http://localhost:8080/..."}}}} -
Claude Code: Standard env vars:
ANTHROPIC_BASE_URL,OPENAI_BASE_URL -
Bedrock:
ANTHROPIC_BEDROCK_BASE_URL -
Ollama:
OLLAMA_HOST
Request Shaping for Token Visibility
OpenAI-format providers (including DeepSeek) omit the usage block from streaming responses unless stream_options.include_usage is explicitly set. AAP injects this flag on every streaming request before forwarding. The agent never sees it, but token counts are preserved.
Capture: NDJSON at Wire Speed
Every request is captured as a sequence of six event types, one JSON object per line:
request        → { type: "request", ts, sessionId, requestId, provider, method, path, headers }
request_body   → { type: "request_body", ts, data: "" }  (1+ chunks)
response       → { type: "response", ts, status, headers }
response_body  → { type: "response_body", ts, data: "" }  (N chunks, streaming)
error          → { type: "error", ts, phase, message }
end            → { type: "end", ts, status, latencyMs, requestBytes, responseBytes }
The capture trace class writes each event to a stream, accumulates byte counters, and on finish() emits a terminal end event:
class FileRequestTrace {
  private writeEvent(event): void {
    this.stream.write(JSON.stringify(event) + "\n")  // fire-and-forget, no await
  }

  requestChunk(chunk): void {
    this.requestBytes += chunk.length
    this.writeEvent({ type: "request_body", ts: Date.now(), data: chunk.toString("base64") })
  }

  responseChunk(chunk): void {
    this.responseBytes += chunk.length
    this.writeEvent({ type: "response_body", ts: Date.now(), data: chunk.toString("base64") })
  }

  finish(): void {
    if (this.finished) return
    this.finished = true
    this.writeEvent({
      type: "end", ts: Date.now(), status: this.status,
      latencyMs: Date.now() - this.ctx.startedAt,
      requestBytes: this.requestBytes, responseBytes: this.responseBytes
    })
    this.stream.end()
    this.store.finishRequest(this.ctx.requestId, { ... })
  }
}
Chunks are base64-encoded because NDJSON is text, but wire bytes are binary (gzip/brotli-compressed SSE streams). Stream writes are fire-and-forget. If a write fails, it logs to stderr but never blocks the proxy.
Redaction: Two Levels
Header-level secrets: 8 header names replaced with [REDACTED]:
- authorization, x-api-key, api-key, proxy-authorization, cookie, set-cookie, x-amz-security-token, x-goog-api-key
Body-level secrets: 11 regex patterns catch common formats:
- Bearer tokens, OpenAI keys (
sk-), Anthropic keys (sk-ant-), HuggingFace tokens, xAI keys, Google keys, DeepSeek keys, Amazon Nova keys, Meta Llama references, Google Gemini references.
Parsing: Four Incompatible Streaming Formats
The four providers stream tool calls and tokens completely differently. There is no standard.
Format Comparison
| Property | Anthropic | OpenAI / DeepSeek | Bedrock | Ollama |
|---|---|---|---|---|
| Stream format | SSE | SSE | Binary event-stream | NDJSON |
| Token reporting | message_start.usage + message_delta.usage | Last chunk’s usage | Final metadata.usage | prompt_eval_count on done |
| Cache tokens | cache_read_input_tokens, cache_creation_input_tokens | prompt_cache_hit_tokens | cacheReadInputTokens, cacheWriteInputTokens | Not reported |
| Tool calls | Incremental: content_block_start + content_block_delta | Incremental: choices[].delta.tool_calls[] by index | Incremental: contentBlockStart.toolUse + contentBlockDelta | Complete per chunk |
Tool Call Reassembly
Streaming protocols fragment tool calls across multiple events. For Anthropic:
content_block_startgives the tool name and IDcontent_block_deltastreamspartial_jsonfragments- Parser matches by
record.index, accumulating JSON into a single arguments string Map<number, {id, name, args}>tracks partials, sorted by index on completion
OpenAI/DeepSeek works identically with choices[0].delta.tool_calls[].function.arguments fragments. Ollama is simpler: each message sends complete tool calls in a single event.
Cost Computation
Pricing lives in config.toml, never in source code. Four disjoint token buckets:
cost = (fresh_tokens / 1M) * input_rate
     + (cached_read_tokens / 1M) * cache_read_rate
     + (cached_write_tokens / 1M) * cache_write_rate
     + (output_tokens / 1M) * output_rate
Example config:
[pricing."deepseek-v4-pro"]
inputPerMTok = 0.435
outputPerMTok = 0.87
cacheInputPerMTok = 0.0036       # DeepSeek charges almost nothing for cache reads

[pricing."eu.anthropic.claude-opus-4-8"]
inputPerMTok = 5.0
outputPerMTok = 25.0
cacheInputPerMTok = 0.50          # Anthropic: 10x cheaper reads
cacheWritePerMTok = 6.25          # Writes at 1.25x input
SQLite: The Queryable Mirror
Four core tables. Plain SQL via better-sqlite3, no ORM.
| Table | Purpose | Key Columns |
|---|---|---|
sessions | One row per agent session | id, client, cwd, repo, meta (JSON), title, summary |
requests | One row per LLM API call | id, session_id, provider, method, path, trace_file, status, latency_ms |
metrics | Parsed token/cost per request | request_id, format, model, input_tokens, cached_input_tokens, output_tokens, tool_call_count, cost, kind |
tool_calls | Individual tool invocations | request_id, ordinal, name, arguments (JSON), tool_id, result_bytes, result_tokens, error |
All writes use ON CONFLICT DO UPDATE. Parsing is fully idempotent. Run aap parse --all to rebuild metrics from raw traces.
Schema Migrations Without Downtime
function ensureColumn(db, table, column, definition): void {
  const cols = db.prepare(`PRAGMA table_info(${table})`).all();
  if (!cols.some(c => c.name === column)) {
    db.exec(`ALTER TABLE ${table} ADD COLUMN ${column} ${definition}`);
  }
}
No drop tables, no migrations, no downtime. Just add columns as needed.
Tool Call Tracking Across Conversations
Tool calls are tracked across both sides of the conversation:
- Tool invocations are written to
tool_callsfrom parsing the response body - Tool results update the same row (
result_bytes,result_tokens,error) from parsing the request body of the following request
Pipeline Separation
- Hot path: Capture writes
requestsimmediately - 3s tick: Parse writes
metrics+tool_callsoff the hot path - 5s tick: Search writes
chunks+ FTS5 in a separatesearch.sqlitefile
This separation ensures indexing never contends with proxy writes.
The Tool Loop: Where 80% of Traffic Comes From
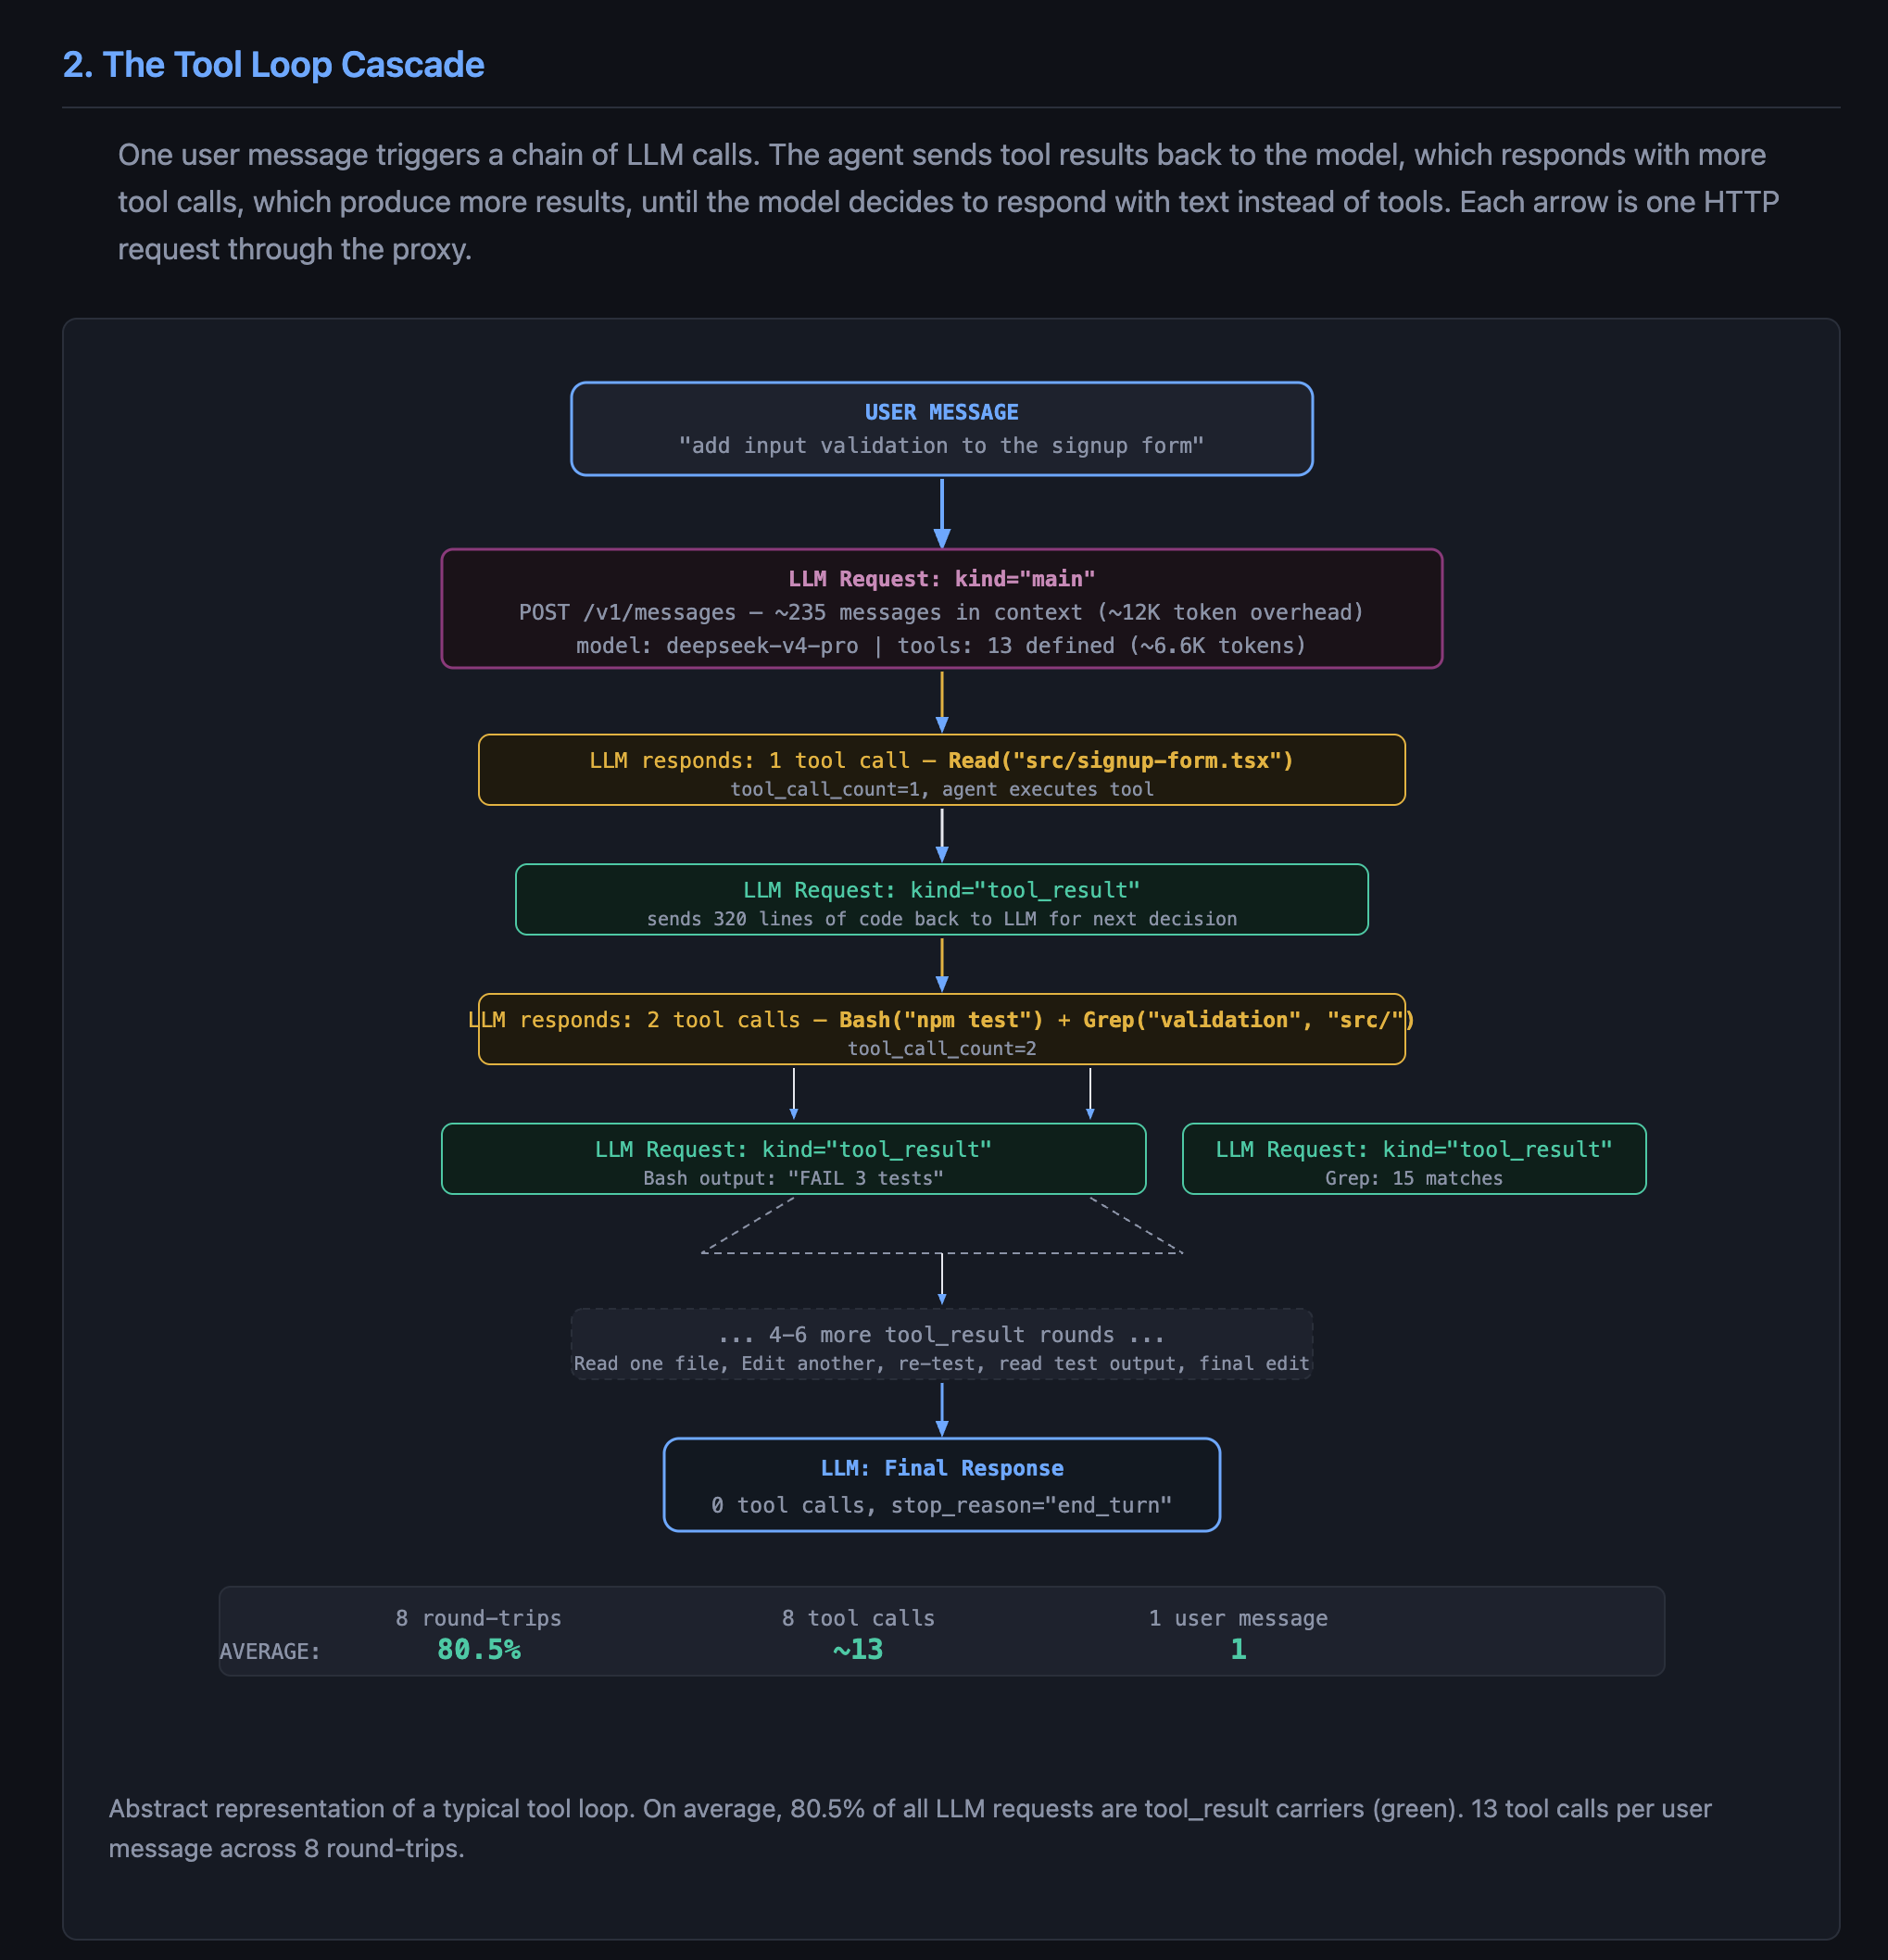
Most LLM traffic is not the user talking to the agent. It is the agent talking to itself.
Distribution by Request Kind
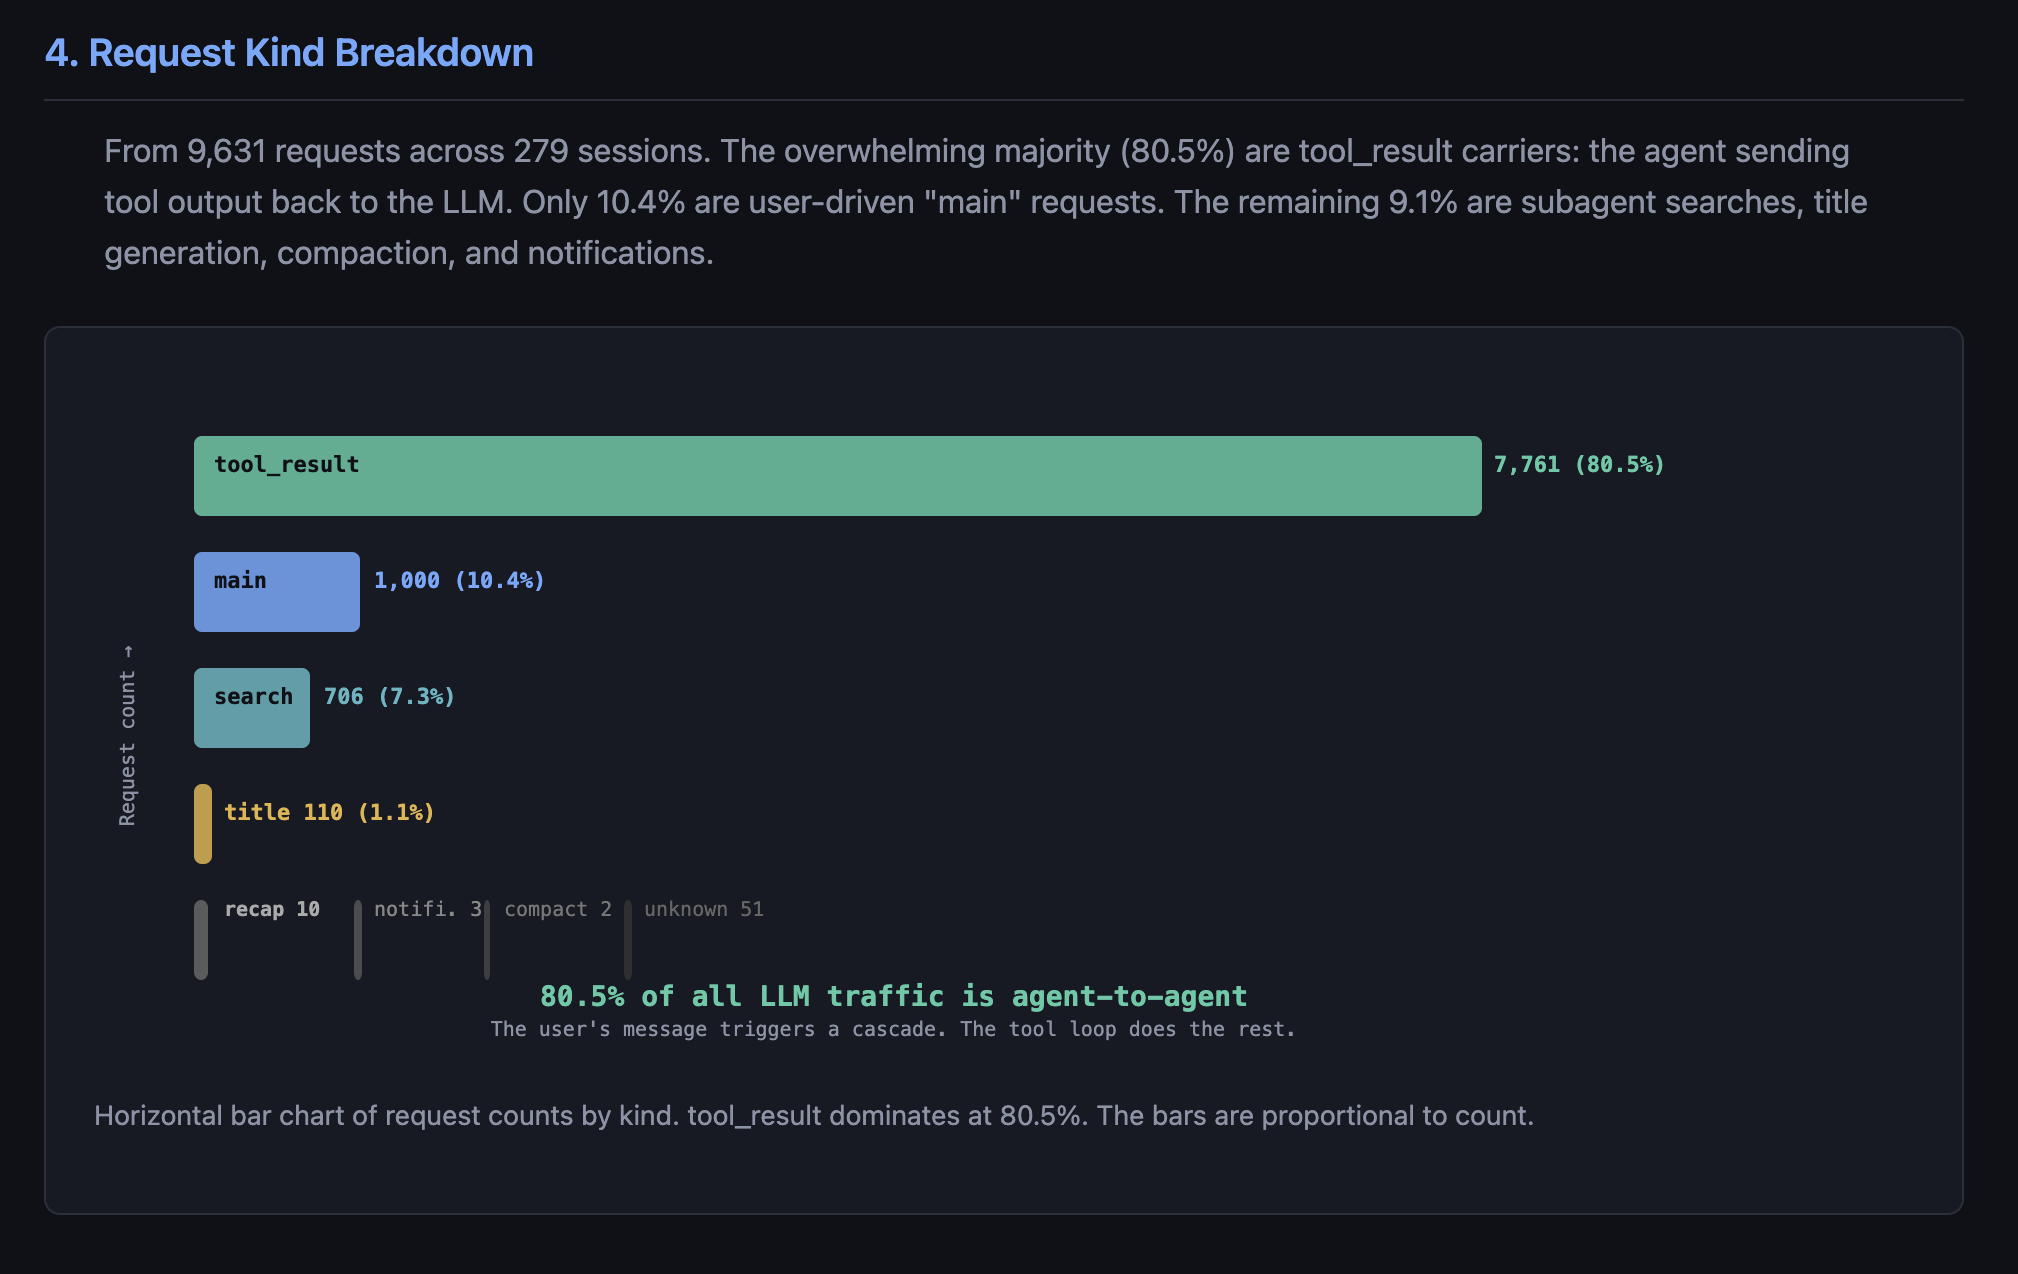
The Numbers (Production Data)
| Request Kind | Count | Percentage | What It Is |
|---|---|---|---|
tool_result | 7,761 | 80.5% | Agent sends tool output back to LLM for next decision |
main | 1,000 | 10.4% | User message triggers a new LLM call |
search | 706 | 7.3% | File-search subagent grepping the repo |
title | 110 | 1.1% | Title generation |
recap | 10 | 0.1% | Mid-session catch-up summary |
notification | 3 | <0.1% | Async background task notifications |
compact | 2 | <0.1% | Context compaction summarization |
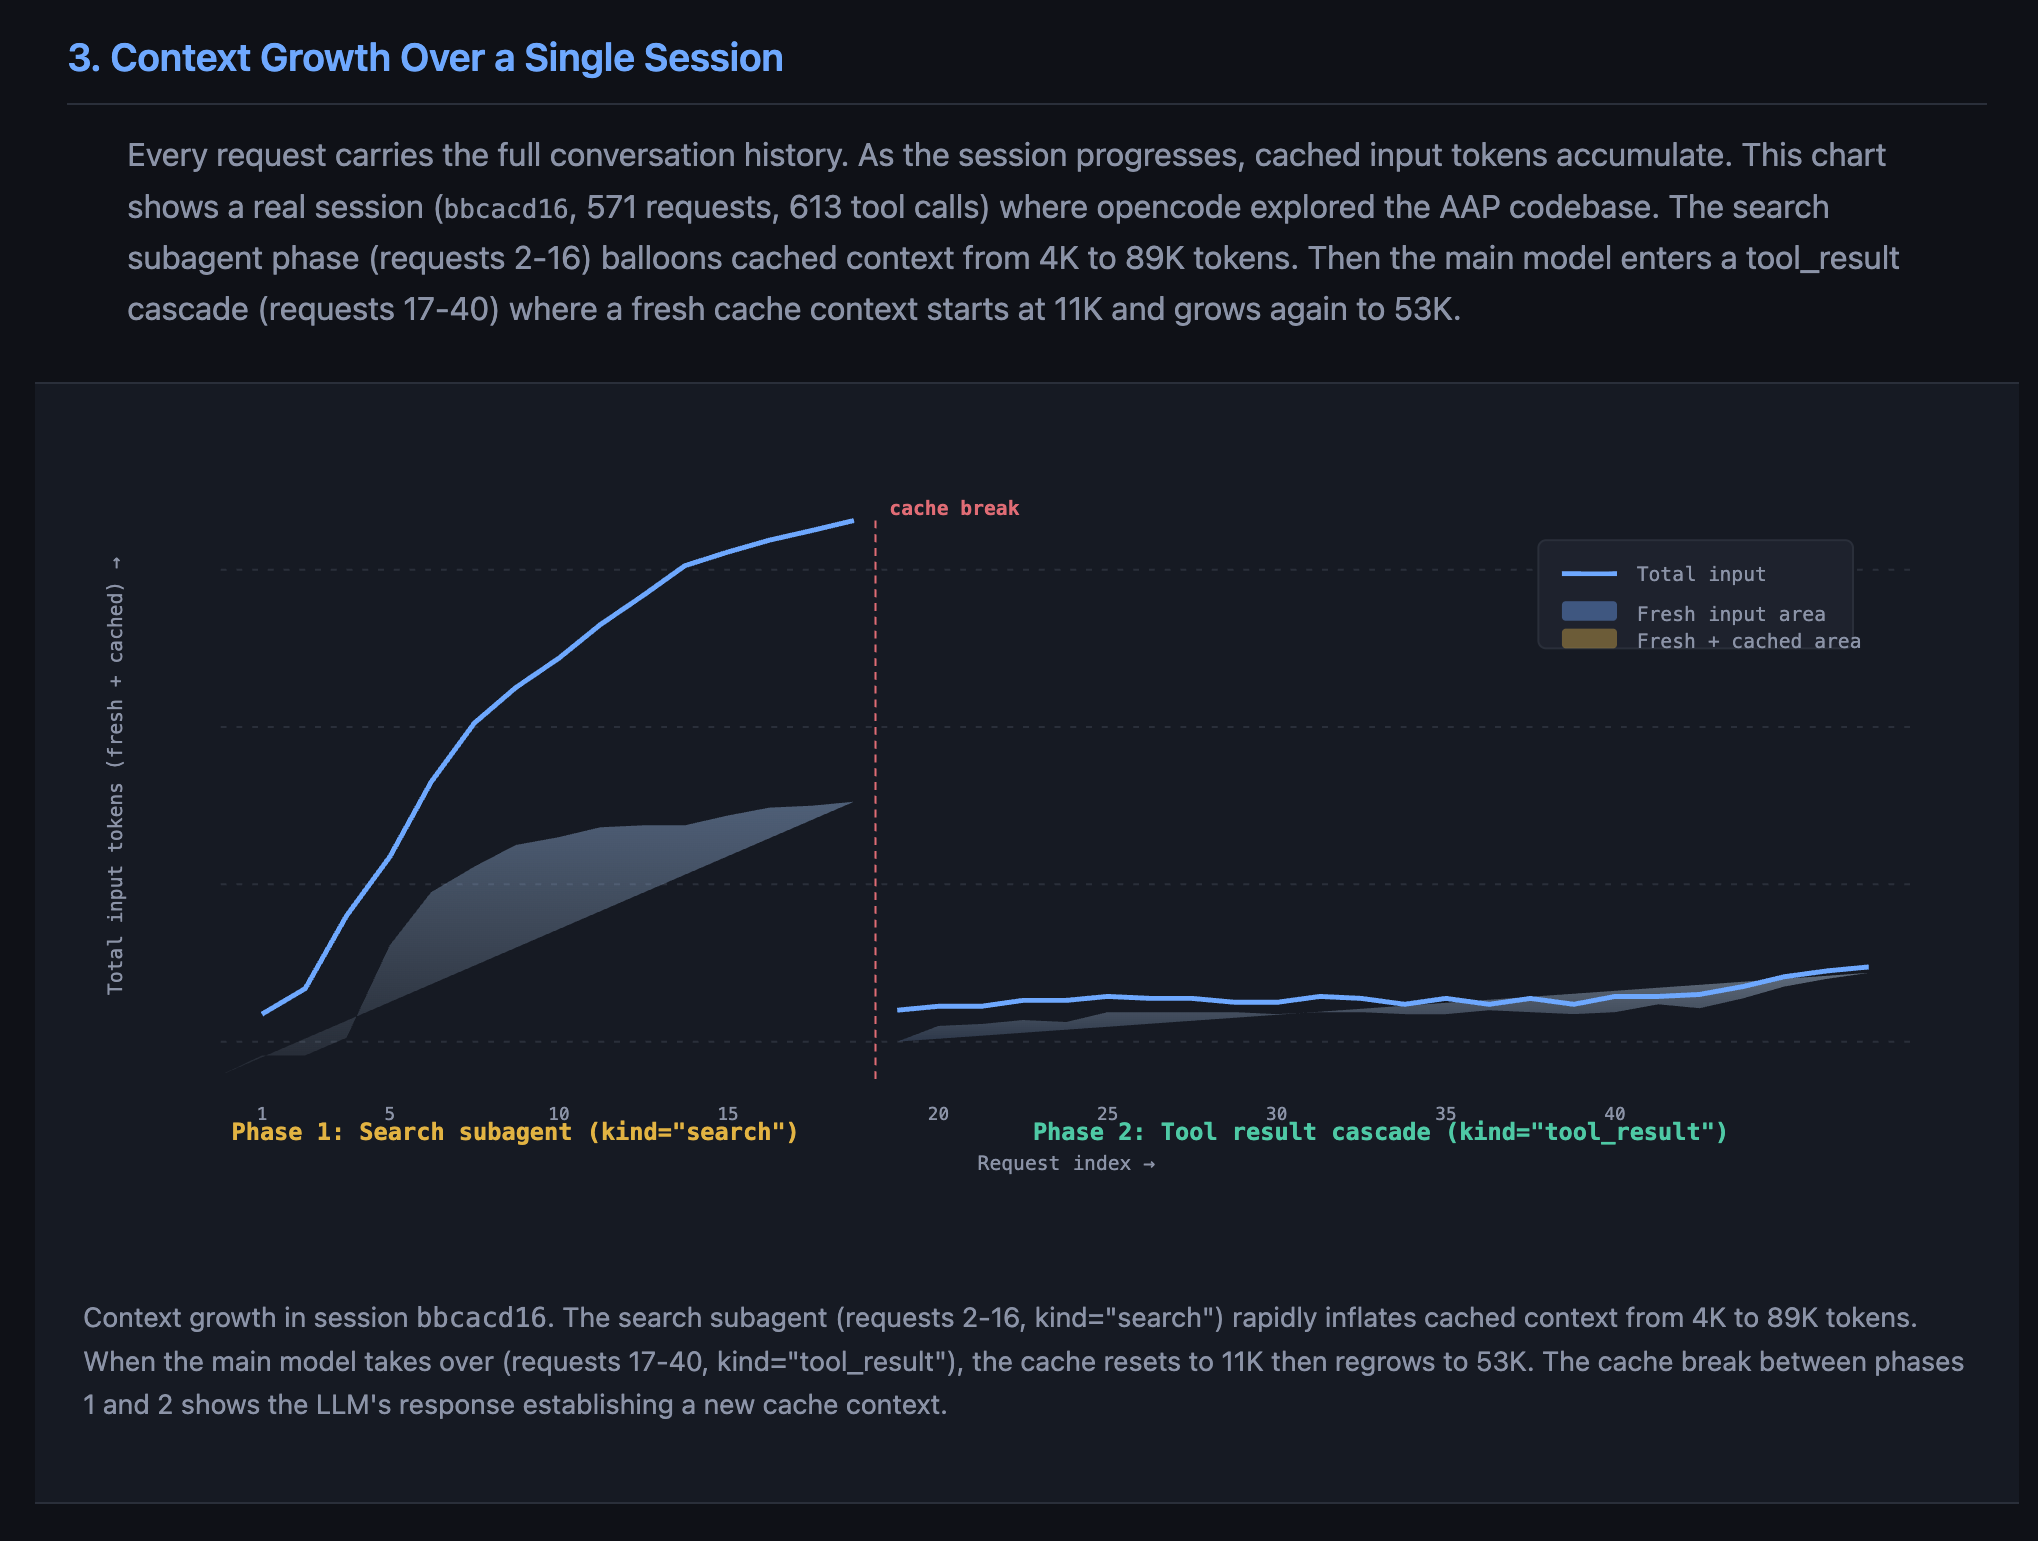
The real bottleneck is the tool loop. After each tool invocation, the agent calls the LLM again to decide what to do next. A single user query spawns ~13 tool calls per message, most of them feeding results back into the agent loop.
Key Insights
Cache is King
96.7% cache hit rate means prompts are deterministic and repetitive. Once the prompt prefix is cached, subsequent requests cost almost nothing. This is why proper cache management is the single biggest lever for controlling agent cost.
Agent vs. User Traffic
80.5% of all API calls are tool_result requests—the agent talking to itself between tool invocations. Only 10.4% are user-triggered. This is the computational reality: most cycles are spent in the loop, not responding to you.
Cost Efficiency
9,631 LLM requests across 279 sessions generate 1.0 GB of traces and cost $33.88 total. That’s full token and tool visibility with per-request latency metrics. The marginal cost per request is negligible with proper caching.
Protocol Fragmentation
Supporting four LLM SDKs means parsing four streaming formats, four token reporting mechanisms, and four cache semantics. There is no standard. This complexity is the reason AAP exists.
Try It Out
Repository: github.com/anomalyco/ai-agent-profiler
Supported Agents: Claude Code, opencode, StackPilot
Supported Providers: Anthropic, DeepSeek, OpenAI, Ollama, Bedrock
Run aap run claude to start profiling your agent sessions. Everything stays local. No cloud, no registration, no framework dependencies. Just you, your traces, and the raw truth about what your agent is actually doing.